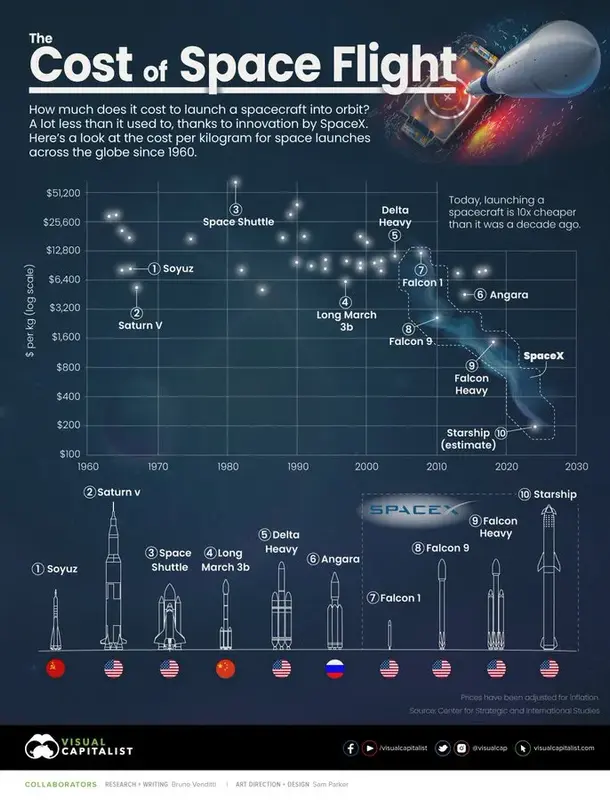
soumerd_retardataire@lemmy.world to Data is Beautiful@lemmy.worldEnglish · edit-22 years ago10x cheaper than in 2010, and 40x-100x cheaper than in the 90s. It'll probably continue to decrease.imagemessage-square19linkfedilinkarrow-up145arrow-down117
arrow-up128arrow-down1image10x cheaper than in 2010, and 40x-100x cheaper than in the 90s. It'll probably continue to decrease.soumerd_retardataire@lemmy.world to Data is Beautiful@lemmy.worldEnglish · edit-22 years agomessage-square19linkfedilink
minus-squaresoumerd_retardataire@lemmy.worldOPlinkfedilinkEnglisharrow-up1·edit-22 years agoYeah, and the curve would be even worse if the y-axis was linear b.t.w. 🤷
minus-squareFermion@feddit.nllinkfedilinkEnglisharrow-up2·2 years agoI think this actually is a linear regression plotted on a log y graph. Which a linear regression is a bad choice for something that must be asymptotic at best.
Yeah, and the curve would be even worse if the y-axis was linear b.t.w. 🤷
I think this actually is a linear regression plotted on a log y graph.
Which a linear regression is a bad choice for something that must be asymptotic at best.